大家好,很高兴又见面了,我是"高级前端进阶",由我带着大家一起关注前端前沿、深入前端底层技术,大家一起进步,也欢迎大家关注、点赞、收藏、转发!
 什么是 nivo
nivo provides a rich set of dataviz components, built on top of the awesome d3 and React libraries
nivo 提供增强的 React 组件,可轻松构建数据可视化应用,底层基于 d3 构建。虽然,前端已经存在多个用于 React d3 集成的库,但只有少数库提供服务器端渲染能力和完全声明式图表。

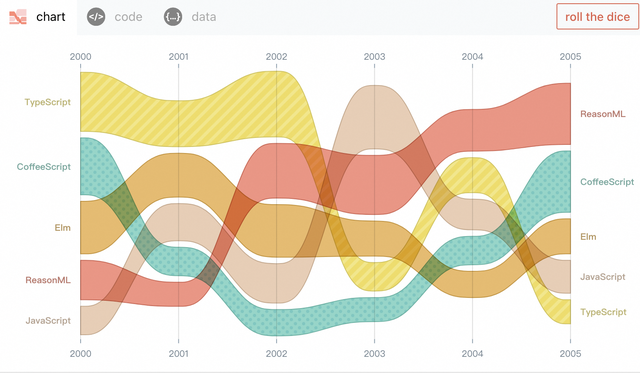
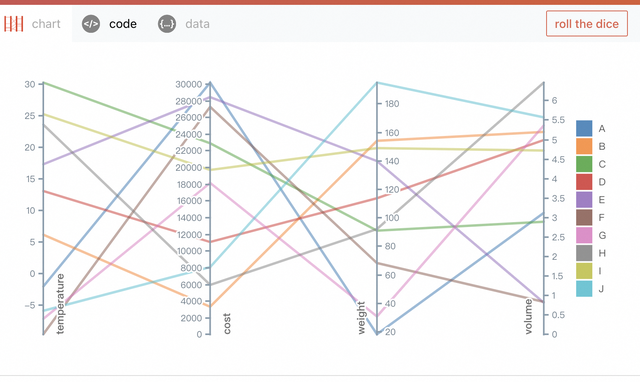
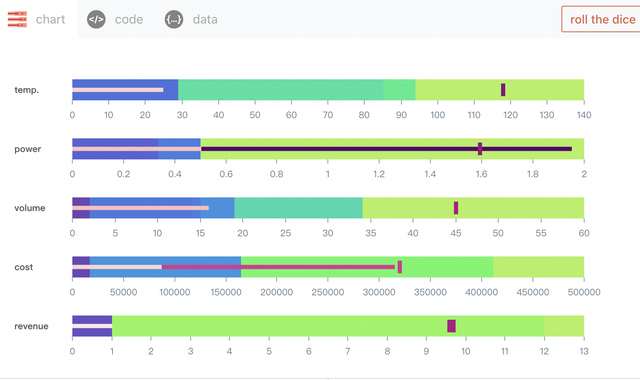
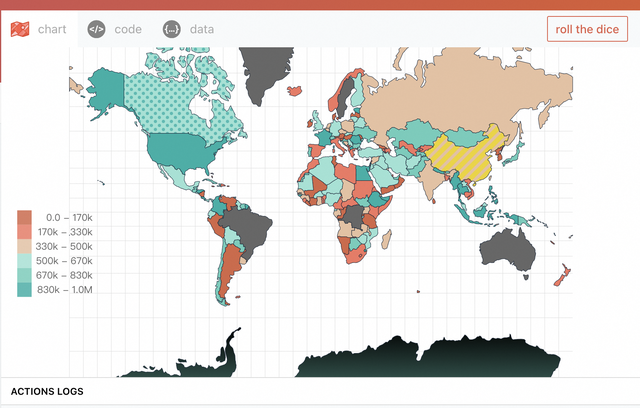
nivo 的典型功能包括:
高度可定制动画 / 过渡,由 @react-spring 提供支持详尽的文档、支持同构渲染、SVG 图表、HTML 图表、画布图表等服务器端渲染 API、SVG 图案、支持渐变和响应式图表目前 nivo 在 Github 通过 MIT 协议开源,有超过 12.9k 的 star、1k 的 fork、1.9k 的项目依赖量、代码贡献者 200+、妥妥的前端优质开源项目。
如何使用 nivo为了使用 nivo,开发者必须安装 @nivo/core 软件包,然后根据希望使用的图表选择一些范围内的 @nivo 软件包:
yarn add @nivo/core @nivo/barnivo 支持多种图表类型,比如:AreaBump 图表与 Bump 图表类似,但其不仅显示随时间变化的排名,还显示 y 轴上的值。而如果只对排名感兴趣,也可以使用 Bump 组件。
此组件的响应式替代方案是 ResponsiveAreaBump。
import {ResponsiveAreaBump} from '@nivo/bump'const MyResponsiveAreaBump = ({data}) => ( <ResponsiveAreaBump data={data} margin={{top: 40, right: 100, bottom: 40, left: 100}} spacing={8} colors={{scheme: 'nivo'}} blendMode="multiply" defs={[ { id: 'dots', type: 'patternDots', background: 'inherit', color: '#38bcb2', size: 4, padding: 1, stagger: true }, { id: 'lines', type: 'patternLines', background: 'inherit', color: '#eed312', rotation: -45, lineWidth: 6, spacing: 10 } ]} fill={[ { match: { id: 'CoffeeScript' }, id: 'dots' }, { match: { id: 'TypeScript' }, id: 'lines' } ]} startLabel="id" endLabel="id" axisTop={{ tickSize: 5, tickPadding: 5, tickRotation: 0, legend: '', legendPosition: 'middle', legendOffset: -36, truncateTickAt: 0 }} axisBottom={{ tickSize: 5, tickPadding: 5, tickRotation: 0, legend: '', legendPosition: 'middle', legendOffset: 32, truncateTickAt: 0 }} />)条形图可以显示多个数据系列,堆叠或并排,支持垂直和水平布局,负值在 x 轴(或 y 轴,如果使用水平布局)以下下降。可以自定义条形图项目组件以渲染任何有效的 SVG 元素,其将接收当前条形图样式、数据和事件处理程序:
import {ResponsiveBar} from '@nivo/bar'const MyResponsiveBar = ({data}) => ( <ResponsiveBar data={data} keys={[ 'hot dog', 'burger', 'sandwich', 'kebab', 'fries', 'donut' ]} indexBy="country" margin={{top: 50, right: 130, bottom: 50, left: 60}} padding={0.3} valueScale={{type: 'linear'}} indexScale={{type: 'band', round: true}} colors={{scheme: 'nivo'}} defs={[ { id: 'dots', type: 'patternDots', background: 'inherit', color: '#38bcb2', size: 4, padding: 1, stagger: true }, { id: 'lines', type: 'patternLines', background: 'inherit', color: '#eed312', rotation: -45, lineWidth: 6, spacing: 10 } ]} fill={[ { match: { id: 'fries' }, id: 'dots' }, { match: { id: 'sandwich' }, id: 'lines' } ]} borderColor={{ from: 'color', modifiers: [ [ 'darker', 1.6 ] ] }} axisTop={null} axisRight={null} axisBottom={{ tickSize: 5, tickPadding: 5, tickRotation: 0, legend: 'country', legendPosition: 'middle', legendOffset: 32, truncateTickAt: 0 }} axisLeft={{ tickSize: 5, tickPadding: 5, tickRotation: 0, legend: 'food', legendPosition: 'middle', legendOffset: -40, truncateTickAt: 0 }} labelSkipWidth={12} labelSkipHeight={12} labelTextColor={{ from: 'color', modifiers: [ [ 'darker', 1.6 ] ] }} legends={[ { dataFrom: 'keys', anchor: 'bottom-right', direction: 'column', justify: false, translateX: 120, translateY: 0, itemsSpacing: 2, itemWidth: 100, itemHeight: 20, itemDirection: 'left-to-right', itemOpacity: 0.85, symbolSize: 20, effects: [ { on: 'hover', style: { itemOpacity: 1 } } ] } ]} role="application" ariaLabel="Nivo bar chart demo" barAriaLabel={e=>e.id+":"+e.formattedValue+"in country:"+e.indexValue} />)关于 nivo 的更多图表示例可以参考文末资料,本文不再过多展开。
参考资料https://github.com/plouc/nivo
https://nivo.rocks/about/
https://nivo.rocks/bar/
